May I have your attention please: let's talk about ADHD and Medicaid $ — adult day care, "learing" centers and community bloc grants and food stamps can await another day
/
(Continuing on the topic of the previous post)
As part of its response to my inquiry about spending on autism, Chat came up with this interesting fact:
“ABA spending on Medicaid recipients who did not have an autism diagnosis rose from $77.6 million in 2021 to $1.47 billion in 2025—an increase of 1,789%. That is sufficiently extraordinary that it probably deserves its own examination rather than being buried inside the autism figures.”
1. What exactly is the $1.47 billion?
Among people without one of those ASD diagnoses, payments went:
2021: $77.6 million → 2025: $1.47 billion
That's 18.9× as much money in four years, or +1,789%.
This isn't somebody's extrapolation or an advocacy-group estimate. It's CMS's analysis of T-MSIS claims and encounter data covering all 50 states, D.C., Puerto Rico, USVI and Guam, including both fee-for-service and managed-care encounters.
And by 2025, non-autism cases constituted 14.5% of all Medicaid/CHIP ABA spending.
That is remarkable because ABA remains overwhelmingly associated with autism treatment.
2. What were they being treated for?
Here is where it gets much more interesting.
CMS actually tabulated the diagnoses attached to this non-autism ABA population. The dominant diagnosis wasn't another severe developmental disability.
It was ADHD.
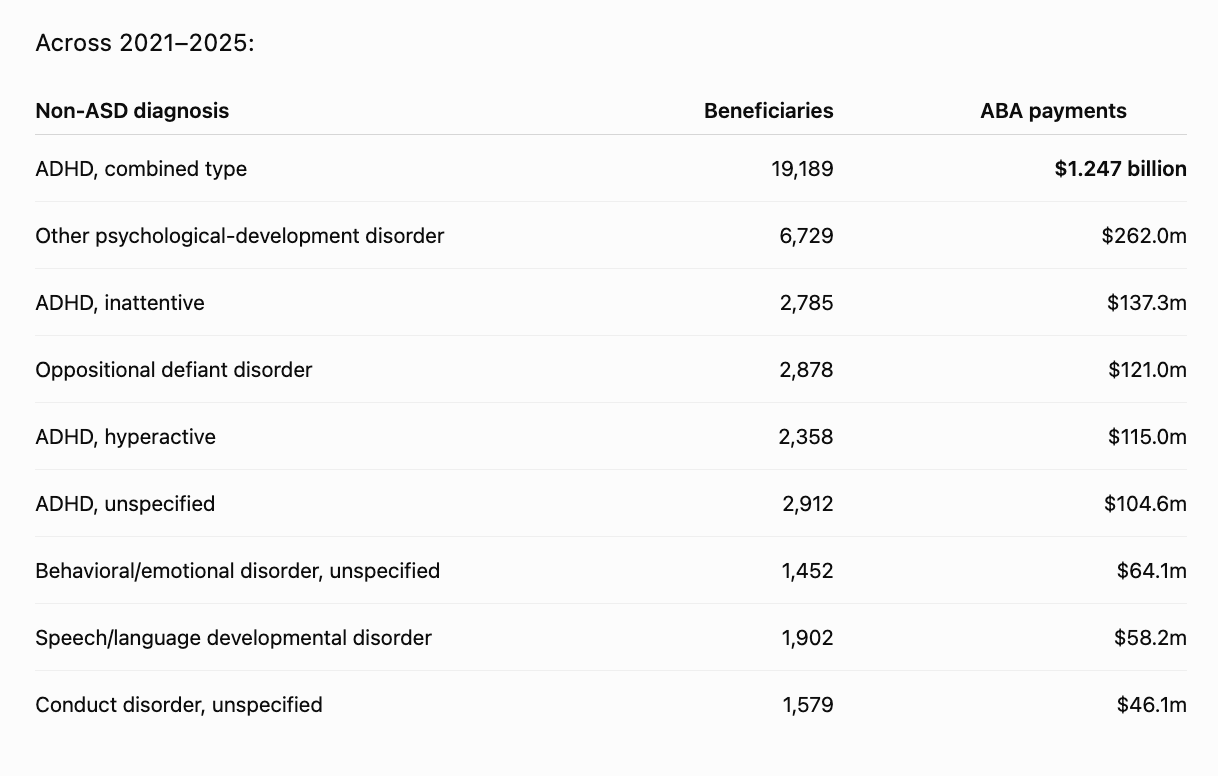
CMS says that ADHD combined type alone represented 40.3% of all non-ASD ABA spending. Add the five ADHD diagnostic codes together and ADHD represents 57% of all non-autism ABA spending during 2021–25.
So this is not principally a story of ABA being used for intellectual disability or severe developmental disorders.
It is substantially an ADHD-treatment story.
3. The spending intensity is extraordinary
The CMS table also supplies per beneficiary per month payments.
For ADHD-combined-type patients receiving ABA:
$4,740 per beneficiary per month.
That's an annualized rate of about:
$56,880 per year.
For several other diagnoses:
ADHD inattentive: $4,643/month ≈ $55,716/year
ADHD hyperactive: $4,532/month ≈ $54,384/year
ADHD unspecified: $4,129/month ≈ $49,548/year
Oppositional defiant disorder: $4,252/month ≈ $51,024/year
Childhood-onset conduct disorder: $4,900/month ≈ $58,800/year
unspecified childhood behavioral/emotional disorder: $4,737/month ≈ $56,844/year
Those are CMS's average payments per beneficiary during months in which the service was received, so multiplying by 12 should not be interpreted as saying every recipient actually cost that amount annually. But it gives you the treatment intensity implied by the claims.
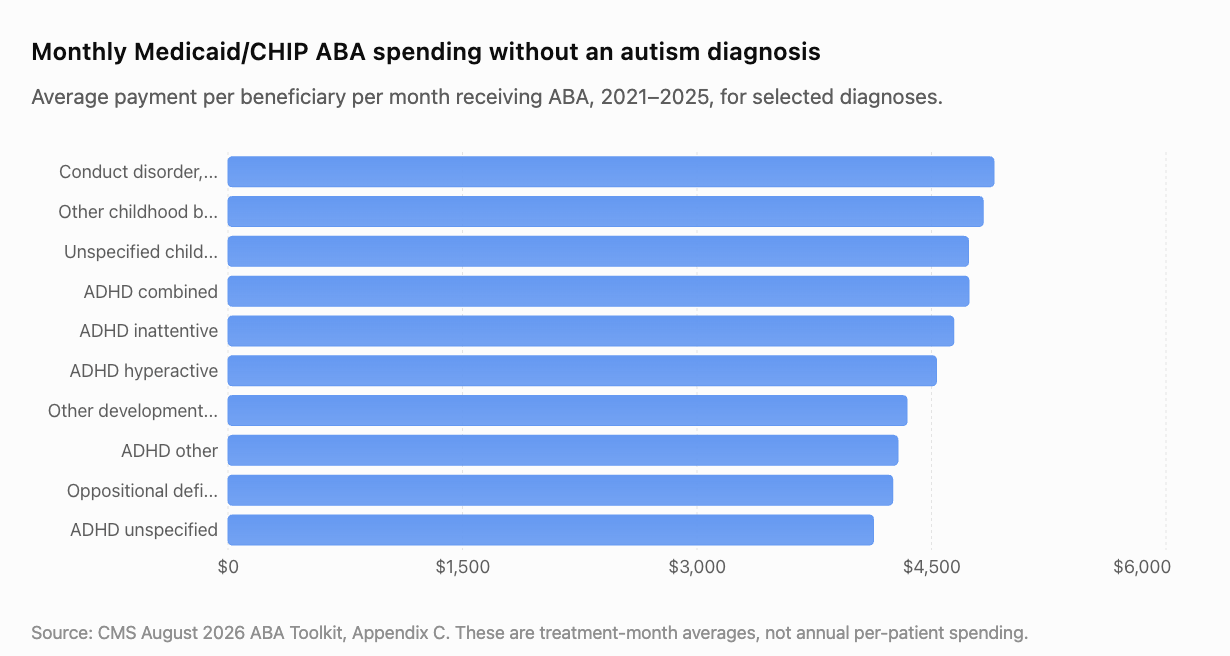
This tells us something important about the 1,789% increase. It isn't merely that Medicaid is occasionally reimbursing a behavior analyst for an ADHD consultation. Some of these patients are receiving extremely intensive—and expensive—ABA.
4. And geographically, the phenomenon is astonishingly concentrated
This may be the biggest red flag in the entire appendix.
CMS reports:
Florida alone paid more than $2.1 billion for ABA delivered to beneficiaries without an autism diagnosis during 2021–2025.
The next-highest state?
Colorado: just over $375 million.
So Florida spent more than 5½ times Colorado's total.
That is very difficult to explain as a nationwide change in medical science. ADHD obviously isn't five times more amenable to ABA in Florida than elsewhere.
It strongly suggests that state reimbursement rules, provider markets, billing practices, benefit interpretation, or some combination thereof are major explanatory variables.
Notice also what this means arithmetically. The entire United States was spending only $77.6 million annually on non-ASD ABA in 2021. Yet Florida alone accumulated more than $2.1 billion over the ensuing five-year period.
That deserves serious scrutiny.
6. The service quantities make it even more interesting
CMS gives another variable: service quantity.
ADHD combined-type beneficiaries accounted for:
98,228,671 units of ABA service during 2021–2025.
There were only 19,189 beneficiaries in that diagnostic category.
The most commonly used ABA CPT codes are generally billed in 15-minute units.
You have to be careful about dividing those numbers directly, because the CMS beneficiary count and service-quantity measures cover multiple years, people enter and exit treatment at different times, and not every CPT code represents identical direct-treatment time.
Nevertheless, the sheer scale is worth noticing:
98.2 million billed units for fewer than 20,000 ADHD-combined beneficiaries.
That's roughly 5,119 service units per unique beneficiary over the five-year observation period.
If they were all 15-minute treatment units—which they aren't necessarily—that would correspond to approximately 1,280 hours per beneficiary.
So these aren't trivial claims.
8. And we already know the broader ABA claims environment has serious integrity problems
HHS-OIG isn't merely expressing theoretical concern. It has conducted a series of state audits.
In Colorado, ABA fee-for-service payments rose from $60.1 million in 2019 to $163.5 million in 2023. OIG's sample found that all 100 sampled enrollee-months contained at least one improper or potentially improper claim line. OIG identified at least $77.8 million in improper payments and another estimated $112.5 million federal share requiring further review.
Wisconsin's audit likewise found at least $18.5 million in improper ABA payments, again with every one of its 100 sampled enrollee-months containing at least one improper or potentially improper claim line.
Indiana: at least $56 million improper. Maine autism-related services: at least $45.6 million improper. HHS-OIG now has an ongoing multi-state ABA audit program specifically because federal and state agencies have identified questionable billing and payments for unallowable services.
Again, an "improper payment" is not synonymous with fraud. It includes documentation and compliance failures. But the error environment is clearly real.
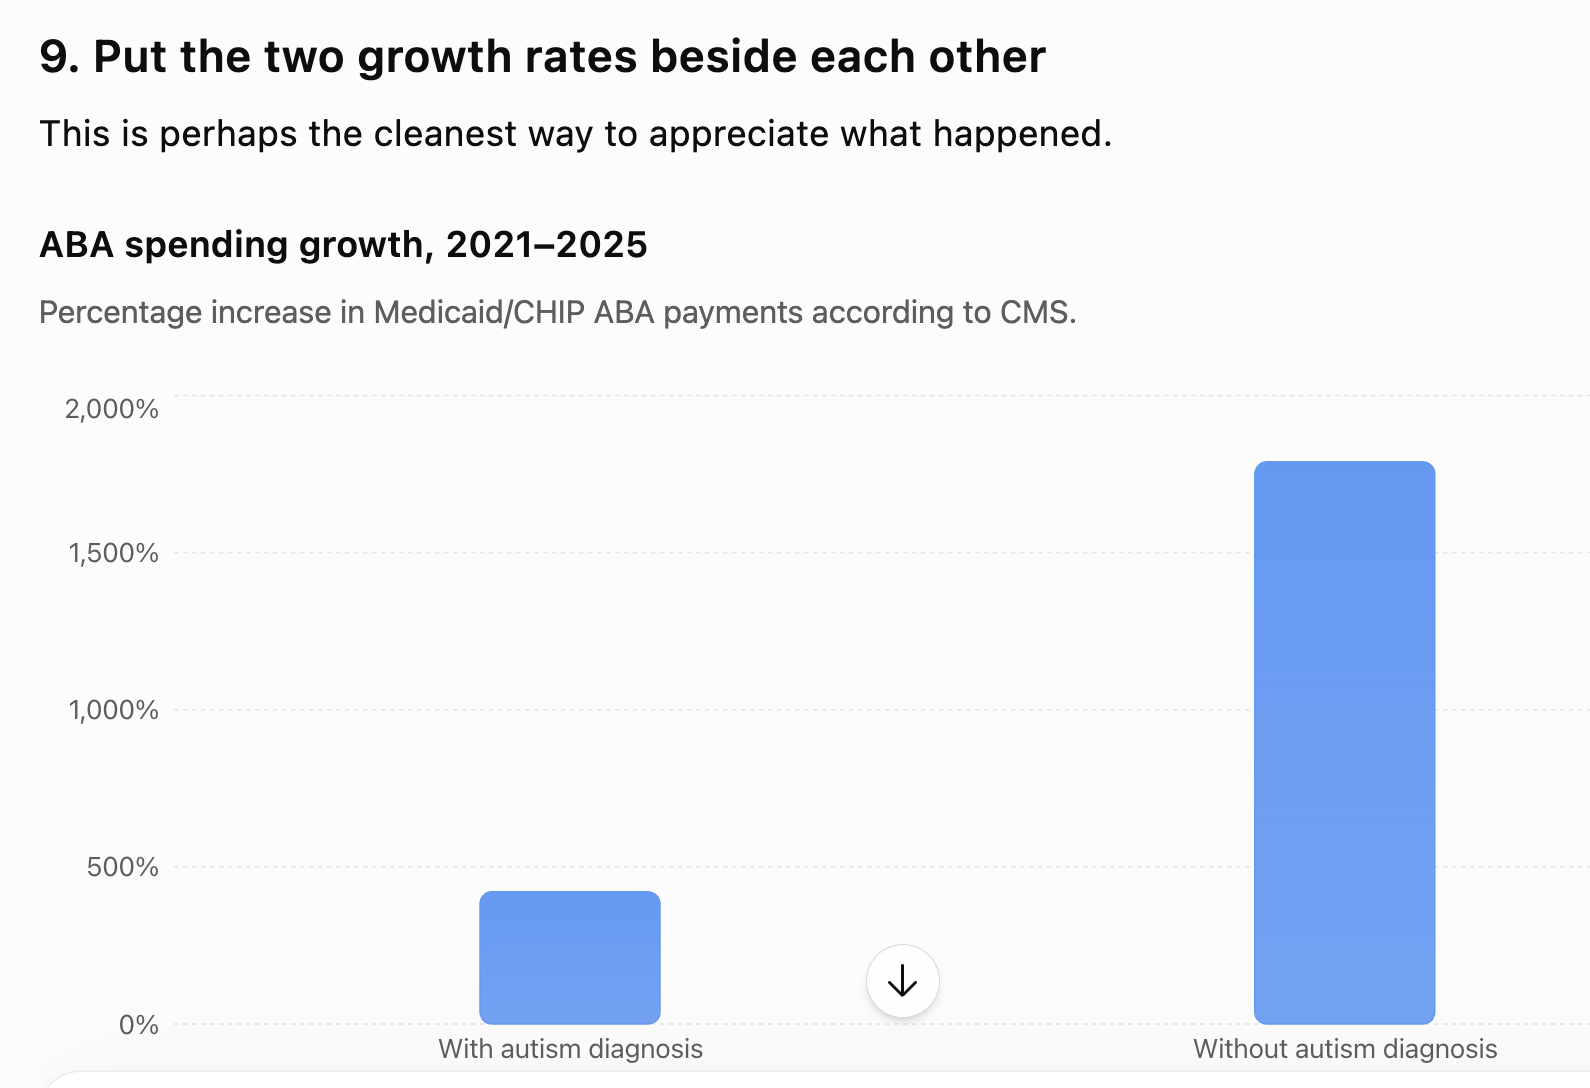
The non-ASD category grew about 4.25 times faster even than the already extraordinary growth rate of ASD ABA spending.
And because compound growth can be easier to grasp than percentages:
ASD ABA: 5.21× in four years.
Non-ASD ABA: 18.89× in four years.
An 18.9-fold increase over four years corresponds to roughly a 109% compound annual growth rate.
In other words, non-autism ABA spending was, on average, more than doubling every year.
10. What could plausibly explain it?
I think there are five hypotheses, and they're not mutually exclusive.
Legitimate expansion of ABA indications. Providers and Medicaid programs may increasingly be using behavioral analysis for ADHD, disruptive behavior, intellectual disability and developmental disorders. Some portion unquestionably belongs here.
Diagnostic sequencing/access. A child awaiting a formal autism evaluation could receive ABA under another diagnosis. CMS explicitly discusses barriers and delays in obtaining ASD diagnoses. That could cause legitimate ABA to appear temporarily in the non-ASD bucket.
State-policy arbitrage. Providers respond to reimbursement rules. Florida's >$2.1 billion versus Colorado's ~$375 million strongly suggests that state-specific policy and market structure matter enormously.
Over-servicing or weak medical-necessity controls. A legitimate patient may receive far more billable treatment than clinically warranted. That is waste or abuse rather than necessarily fraud—and the CMS toolkit spends a remarkable amount of space addressing precisely this problem.
Fraud. Phantom sessions, inflated units, unqualified providers, impossible hours, falsified documentation, kickbacks or medically unnecessary treatment can generate exactly this sort of claims growth. CMS explicitly says investigations have resulted in prosecutions and that fraud, waste and abuse have become significant fiscal concerns.
The available aggregate data cannot tell us what fraction belongs in each bucket.
Where I land after examining it
The 1,789% number alone is startling but doesn't establish much.
The combination is much harder to dismiss:
18.9× spending growth in four years + 57% of non-ASD spending associated with ADHD + ~$4,000–$4,900 per treatment-month for many leading diagnoses + extreme geographic concentration in Florida + documented high improper-payment rates in ABA audits + CMS suddenly publishing a 173-page toolkit with an entire chapter titled “Preventing Applied Behavior Analysis Fraud, Waste, and Abuse.”
That is a fairly strong signal that we're looking at something more complicated than a benign expansion of evidence-based behavioral treatment.
The most tantalizing unanswered question is Florida. More than $2.1 billion of non-autism ABA in one state is extraordinary. I'd next investigate Florida Medicaid specifically: when its coverage rules changed, which diagnoses qualify, annual non-ASD ABA spending, number of recipients, reimbursement rates, provider growth, ownership/concentration, enforcement cases, and whether a small number of providers account for a disproportionate share of claims. That could tell us whether Florida is essentially driving the national 1,789% phenomenon.