
Liars, liars, pants on fire
/
I post on this fraud every summer, showing the weather maps that are now displayed in hysterical red vs the neutral colors used for the same temperatures before Al Gore warmed up the planet, charts showing that the “record temperatures” in cities like Portland, Oregon and Bangor, Maine, were actually set in the early 1900s, not the past few summers, and so on. Here’s this year’s:
Read this post today and it sounded familiar - "hottest on record/fossil energy greed" yada yada yada.
— US Oil & Gas Association (@US_OGA) June 30, 2026
Did some digging and like clockwork - the good Senator puts up nearly identical posts every summer when it gets hot - dating back to 2016.
Here a sample of the last ten… https://t.co/cMceN567WF
And:
D.C. will be hotter than 99 percent of the planet on Friday.
— Ben Noll (@BenNollWeather) July 2, 2026
Only parts of Africa's Sahara Desert, the Middle East, China's Gobi Desert and a few spots in the Desert Southwest will be hotter. pic.twitter.com/GGedfFhpr4
The oceans are hotter than they've ever been measured this time of year, with alarming implications for global weather and marine life. https://t.co/ylQum1FZNy pic.twitter.com/30CxerGmCD
— CNN Breaking News (@cnnbrk) July 1, 2026
Meteorologist Chris Martz calls bullshit:
On today's date in 1901, over half of the U.S. was at or above 90°F and nearly 9% of the land area was at least 100°F. The same weather occurring this week occurred exactly 125 years ago, but according to most climate alarmists, it was just weather in 1901, but this week's… pic.twitter.com/hfg90Ofgzf
— Chris Martz (@ChrisMartzWX) July 3, 2026
And from PJMedia:
It’s Them Again: Climate Alarmists Are Trying to Scare You With Their Panicky Maps
In the course of some of the media coaching I’ve done in recent years, there is one slide that always gets the same reaction, which is a sort of surprise and an affirmation at the same time. I use it to illustrate media bias and manipulation. It shows the same German TV meteorologist standing in front of the same map five years apart, on June 21 in both cases, with roughly the same temperatures on the map behind her. Outside of her outfit and hairstyle, the only noticeable change is the color of the map behind her.
The old map from 2017 uses a graphics package that emphasizes normal colors for a forested country like Germany – different shades of green. The temperature numbers are reversed out in white.
Five years later, on June 21, 2022, the map is saturated with gawdy shades of bright red, orange, and yellow. It looks like someone had a bad meal at Taco Bell and got sick.
Visually, the difference between the two maps is the contrast between calm and normalcy, and hyper-alarmism. If the graphics could talk, the 2017 map tells you to relax, while the 2022 version is screaming at you to panic, and to do it now.
Actually, if you study the numbers, the temps are mostly higher on the green map than they are on the puke map.
— illuminatibot (@iluminatibot) April 30, 2025
If you’re wondering when the climate alarmists took over the news business, that’s your window. It didn’t hurt that in between these two dates, we lived through a global pandemic, and news operations worldwide learned how to use the power of fear to drive TV ratings, clicks, and shares.
And so, here we are, once again in late June. Let’s check in once again on those temperatures. In Frankfurt, on June 30, 2026, it’s 84 degrees Fahrenheit. That’s kind of amazing, considering that the internet is flooded with reports that Europeans from France to Italy and Germany are melting due to their own refusal or their leaders’ refusal to allow them to use air conditioning.
In 2022, on the Taco Bell-puke map, it was 80 degrees Fahrenheit. And in 2017, on the same date, in Frankfurt, it was 96 degrees Fahrenheit.
Hold on! Isn’t that on the nice, calm, green map? Isn’t that on the map that no one remembers because the world wasn’t coming to an end in Germany in 2017? But that means it was hotter then in the same German town than it is now. What’s changed?
Mainly, the climate alarmists are in charge now, and they like their maps red, bright red, orange, bright orange, and yellow, bright yellow. No other colors will do.
No, Virginia, Heat Waves are Not More Common
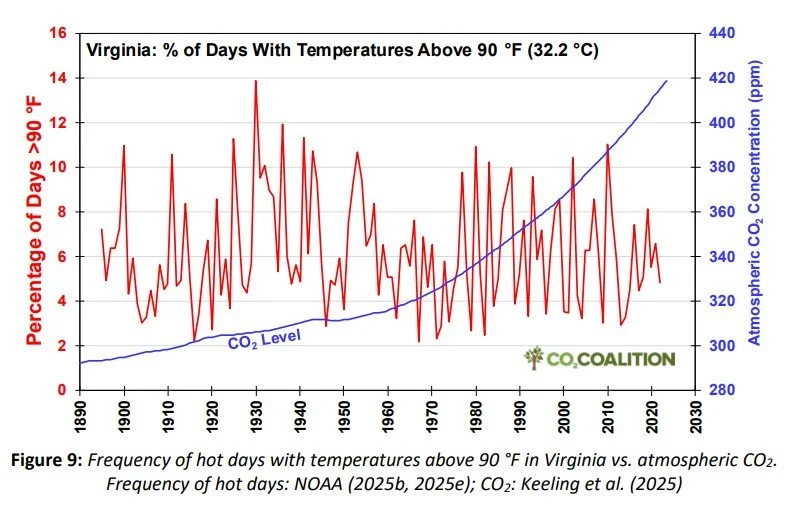
A bit of hard data as the Virginia and national media go into hysterics over a very typical Virginia heat wave and repeat endlessly the claim that this is becoming more frequent. Uh, no, no it’s not. From the CO2 Coalition’s recent updated compilation on “climate stability” in Virginia, worth reading and sharing. While you are staying out of this heat, obviously. (Everything I know about heat safety I learned in kindergarten, at Edwards AFB in the Mohave). — SDH
Airports and temperature readings
England is doing it:
The climate scaremongers: Junk sites behind the Met Office’s so-called heat records
LAST week was even hotter than the summer of 1976, or at least that is what the Met Office keeps telling us. Is that really the case, though?
It was certainly extremely hot for a few days. We were inundated with daily claims of temperature records being broken, forecasts that temperatures could get close to 40C or 104F (they did not) and the obligatory red heat warnings informing us we might die if we step outside our front doors.
But where is the evidence that this heatwave was even more extreme than in 1976? Most people who remember the 1970s would probably say the Met Office is gaslighting us.
In 1976, temperatures hit 35.9C (96.6F) in Cheltenham on July 3. The Met Office reckons that this temperature was exceeded last week.
Top of the list are Lingwood and Santon Downham, both in Norfolk, which they say recorded 37.7C (99.8F) and 37.3C (99.1F) on Friday, a record for June. Santon Downham in Norfolk is, however, one of the most poorly sited weather stations in the country, even by the Met Office’s abysmal standards. It is a Class 5 site, the worst category, which the World Meteorological Organization (WMO) says can add up to 5C of artificial warming. In other words, the temperature at Santon Downham might have been as low as 32.3C (90F) if it had been properly sited.
Lingwood, another Class 5, is even worse. It is just a few yards from a thick bank of trees and surrounded on the other three sides by tall hedges. It is a perfect sun-trap as there is no air circulation.
Class 5s mop up all the stations that don’t meet the criteria to be a Class 4, itself a junk classification. The WMO is absolutely clear – Class 5 sites should not be used for climatological purposes, which is exactly what the Met Office have done here.
Just behind Santon Downham came RAF Wattisham in Suffolk. It is now used as an Army helicopter base, flying Apaches. Wattisham, as with all airfield sites, is criss-crossed with runways, and is home to 2,000 troops, 300 HGVs, 200 Land Rovers and two air ambulances. Hardly a suitable rural site!
On the Thursday, the two highest temperatures were set at RAF Merryfield and RAF Yeovilton, two Royal Navy helicopter bases close together in Somerset. The latter is described by the Navy as ‘one of the busiest military airfields in the UK’.
Maybe you are seeing a pattern here! The day before, on the Wednesday, the Met Office claimed a June record of 36.1C (97F) in Gosport at, you guessed it, yet another helicopter airbase.
It says a lot about the predominance of junk sites in the Met Office’s station network. It also says a lot about helicopters. We are familiar with the artificial warming effect of tarmac runways, but helicopters add another factor – rotor wash. In essence, the rotors push the air downwards during take-off and landing, and that air includes hot exhaust gases. When this air hits the ground, it spreads outward in all directions, creating winds that can easily reach 60 to 100 mph. An excellent way, therefore, of spreading hot air around the airfield. It is well accepted that thermometers at airfields are there so that pilots know the actual conditions on the runway and should never be used as being representative of the wider area.
In fact, no pristine weather station beat the 1976 record of 35.9C. The Met Office claims of record temperatures are wholly derived from junk sites.
And we’re doing it in Connecticut:
Heat dome will make Connecticut feel like it's 114 degrees Friday as heat wave continues
The temperature reached 100 degrees Thursday at Bradley International Airport in Windsor Locks [where Hartford’s temperature is measured] breaking the previous daily heat record of 99 degrees that had stood since 1966, according to the National Weather Service. Temperatures came close to record highs in Bridgeport [as measured at Igor I. Sikorsky Memorial Airport — Ed] but fell short.
Highs are forecast to reach 100 at Bradley and 101 in Bridgeport Friday, potentially setting new temperature records again.
